Metrics are essential to keep track of businesses and teams.
There’s no doubt that tracking team member performance is important. By using our plugin you have access to the most important metrics in one place!
Can you measure and determine employees performance?
Do you want another project to be successful, but you do not know how to properly estimate it?
Do you want to have a tool that will allow you to collect all the information about the project in one place?
Here we are!
Team Performance Reports &Insights for Jira – here in a transparent and easy way you will be able to follow the work that is being done in projects.
Team Performance Reports &Insights for Jira provides excellent visualization of how your team is progressing toward achieving results and delivering value. You can look at both individual team members as well as whole teams in order to compare their key metrics such as keeping on track with estimates.
This plugin can be accessed through both a menu item or inserted into your dashboard as a gadget.
User Interface
In order to show a measure for a given user or team, you will need to select the date range, the Project or Filter and the measured actors themselves.
Data range
First, you will need to select the date range for which you want to display the measure. Only tickets updated in the given time period will be taken into consideration.
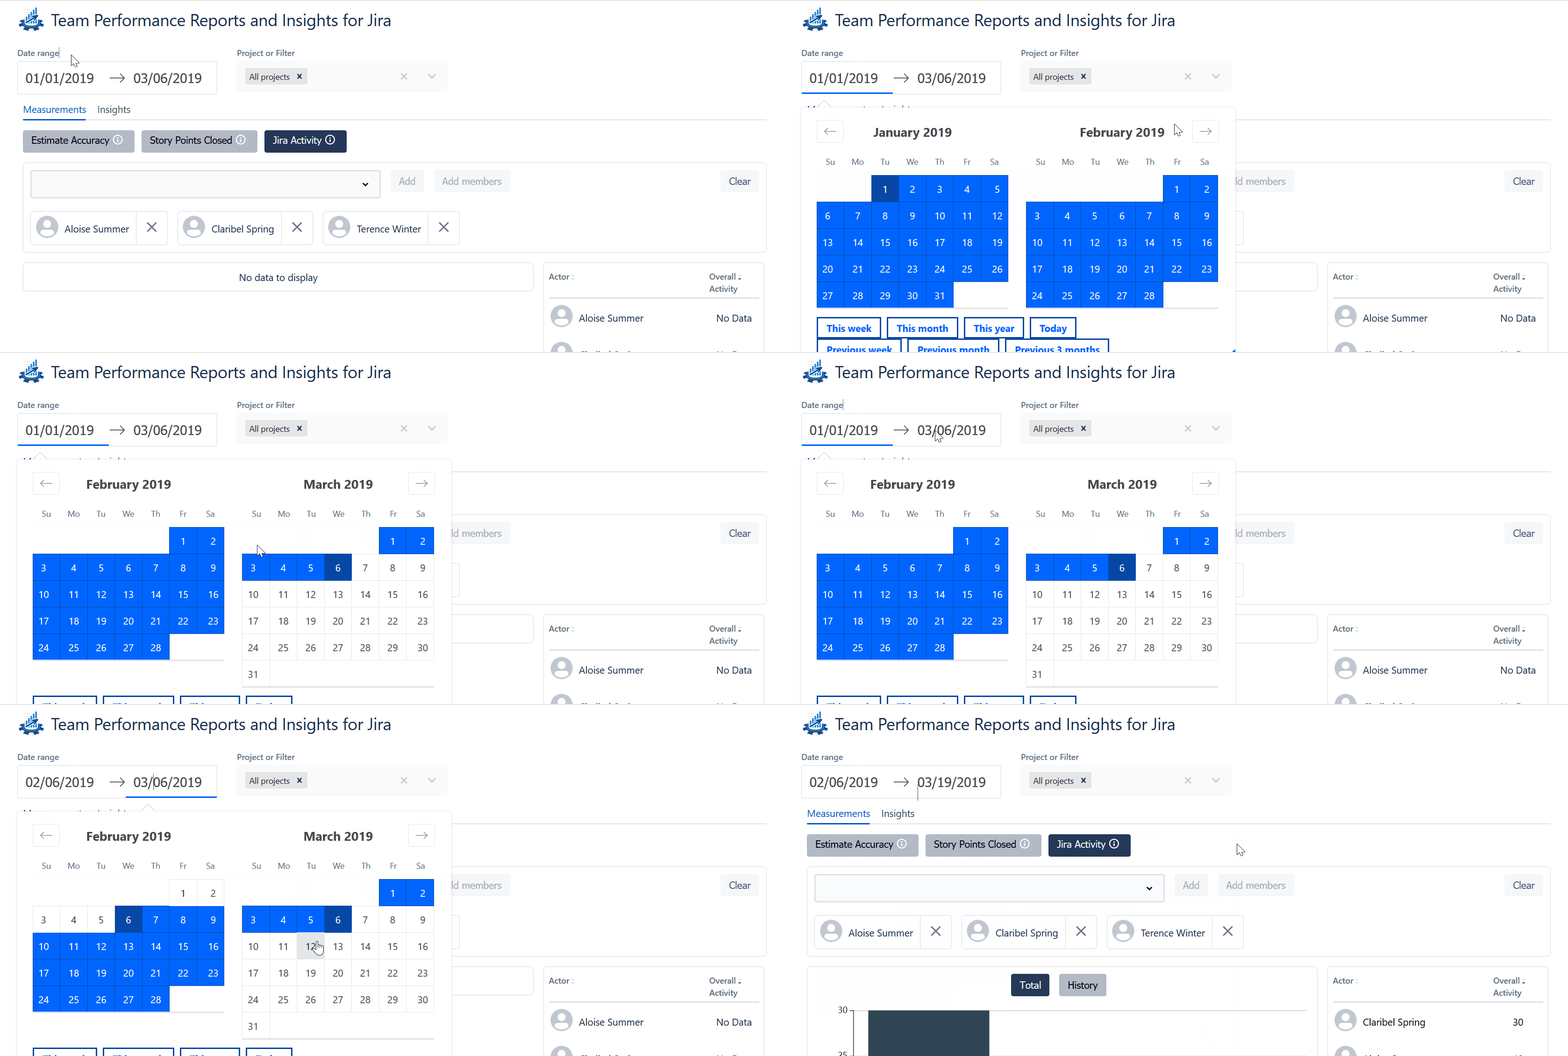
Filter of Project
You can also optionally choose a project or one of your favorited filters to control which tickets will be used for the calculation. Filters and projects can be combined – the measure will work on their sum.

Actor selector
Finally, you will need to select the actors that will be measured. You can select both users and groups. If you select a group, the measure will be calculated for the group as a whole – this will give you the ability to compare whole teams. It is also possible to add all members of a group – in that case, each of them will be measured individually.
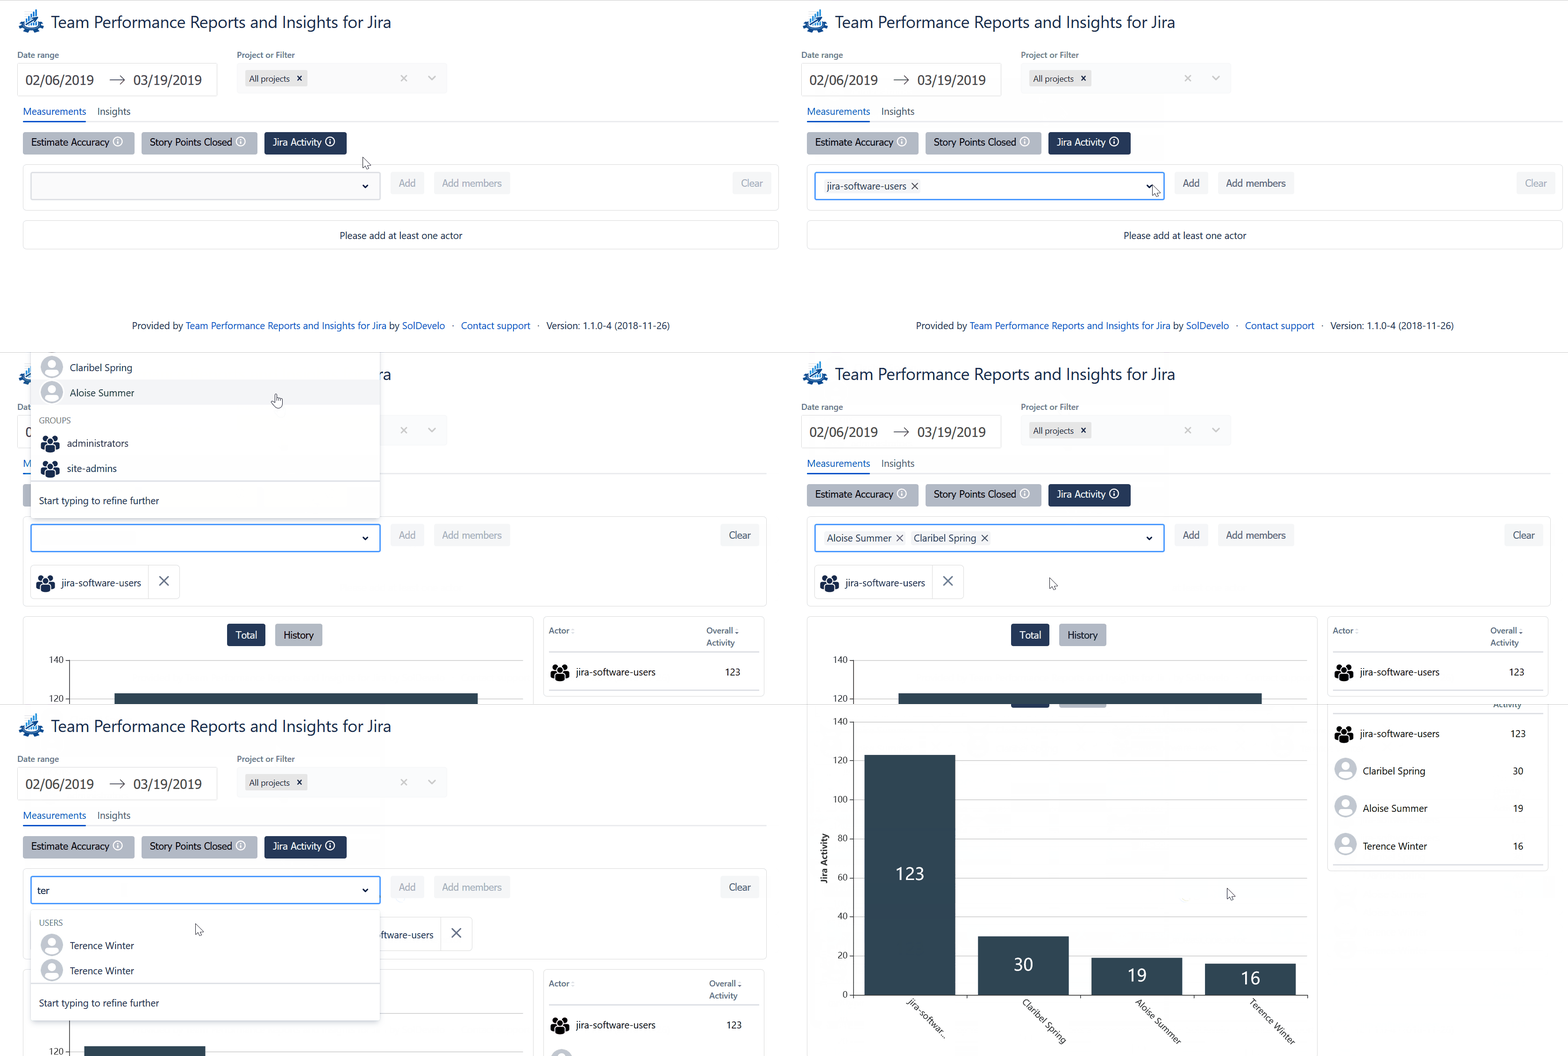
Measurements
We currently support the following measures:
Estimate accuracy is a measure of how closely the team member or group meet estimates in the tickets they log work into.
Total
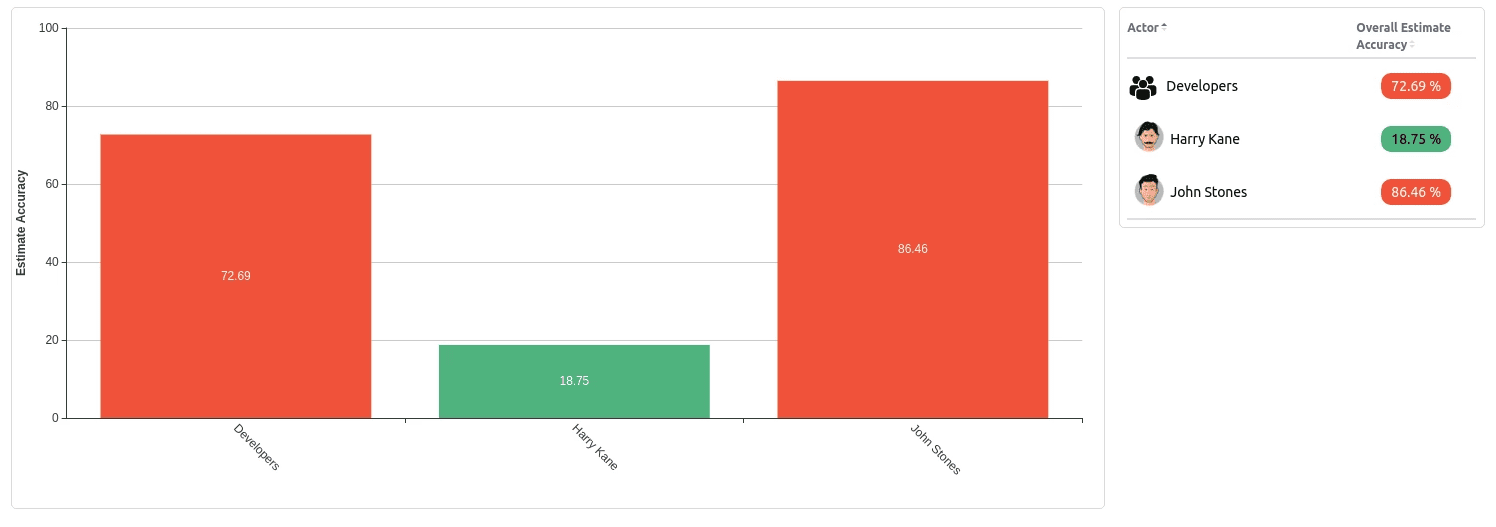
If estimate accuracy is positive, it means that on average the actor needs less time than tickets were estimated for. In the table, you will see these values with a green background. In the graph, you will see green bar.
If estimate accuracy is equal 0, it means that on average the actor needs exactly the time estimated in order to complete the work – he is right on the estimates. In the table, you will see value on grey background with tooltip: “Exactly like estimates”.
If estimate accuracy is negative, it means that on average the actor needs more time than the tickets were estimated for. In the table you will see such values on a red background, the graph bar will also be red.
If there is no data for an actor to calculate “Estimate Accuracy” in the table you will see “No data” message. It will not change graph. This will happen if the user didn’t log any time in any matching and estimated tickets in the given time period.
History
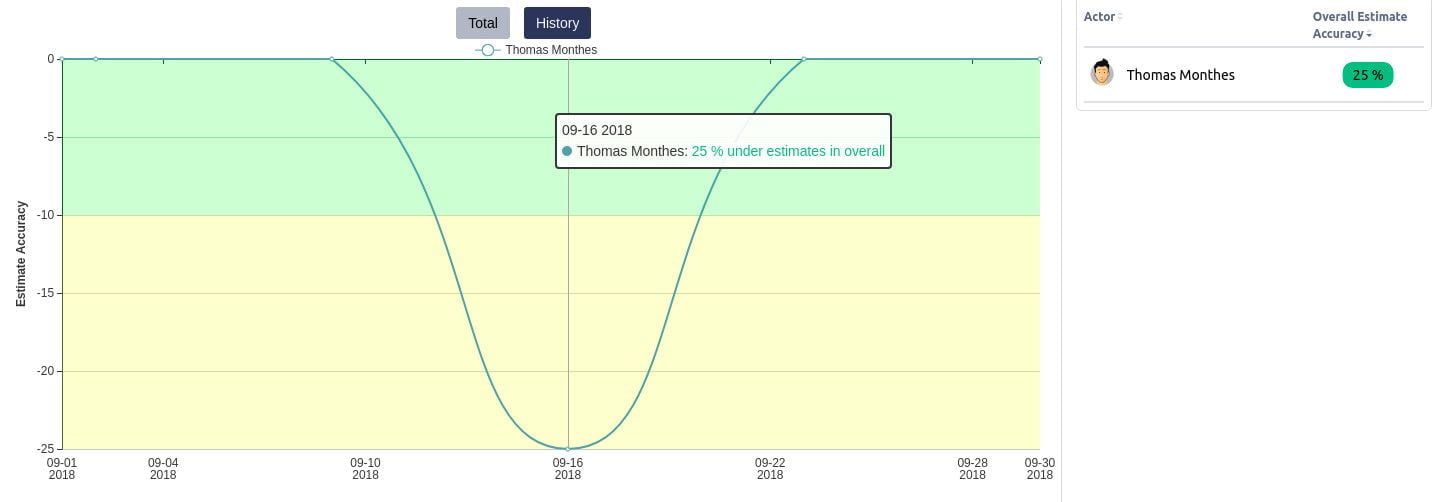
If the actor needed less time than tickets were estimated for – in the graph the value will be under X axis.
If the actor needs exactly the time estimated in order to complete the work – he is right on the estimates. In the graph, the value will be 0.If the actor needed more time than tickets were estimated for – in the graph the value will be over X axis.
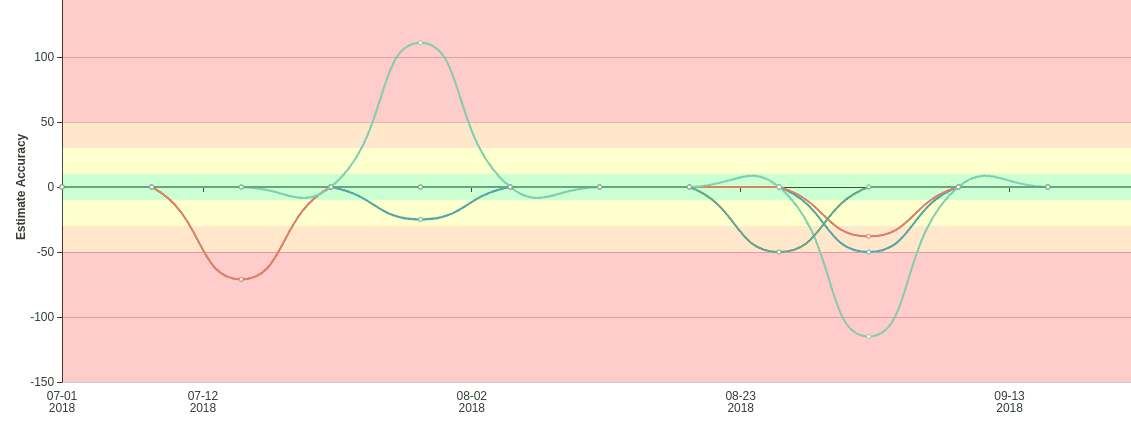
You will still see data table with average estimate accuracy during the chosen period.

Jira Activity
Is a measure that counts all Jira activity and sums it.
Activity types
Following types of activity are counted:
- Issue creation
- Issue change (including transition)
- Issue comment
- Logging work to issue
Each type of activity is counted as 1.
This measure supports two ways of displaying data –Total and History (learn more about this here).
Total
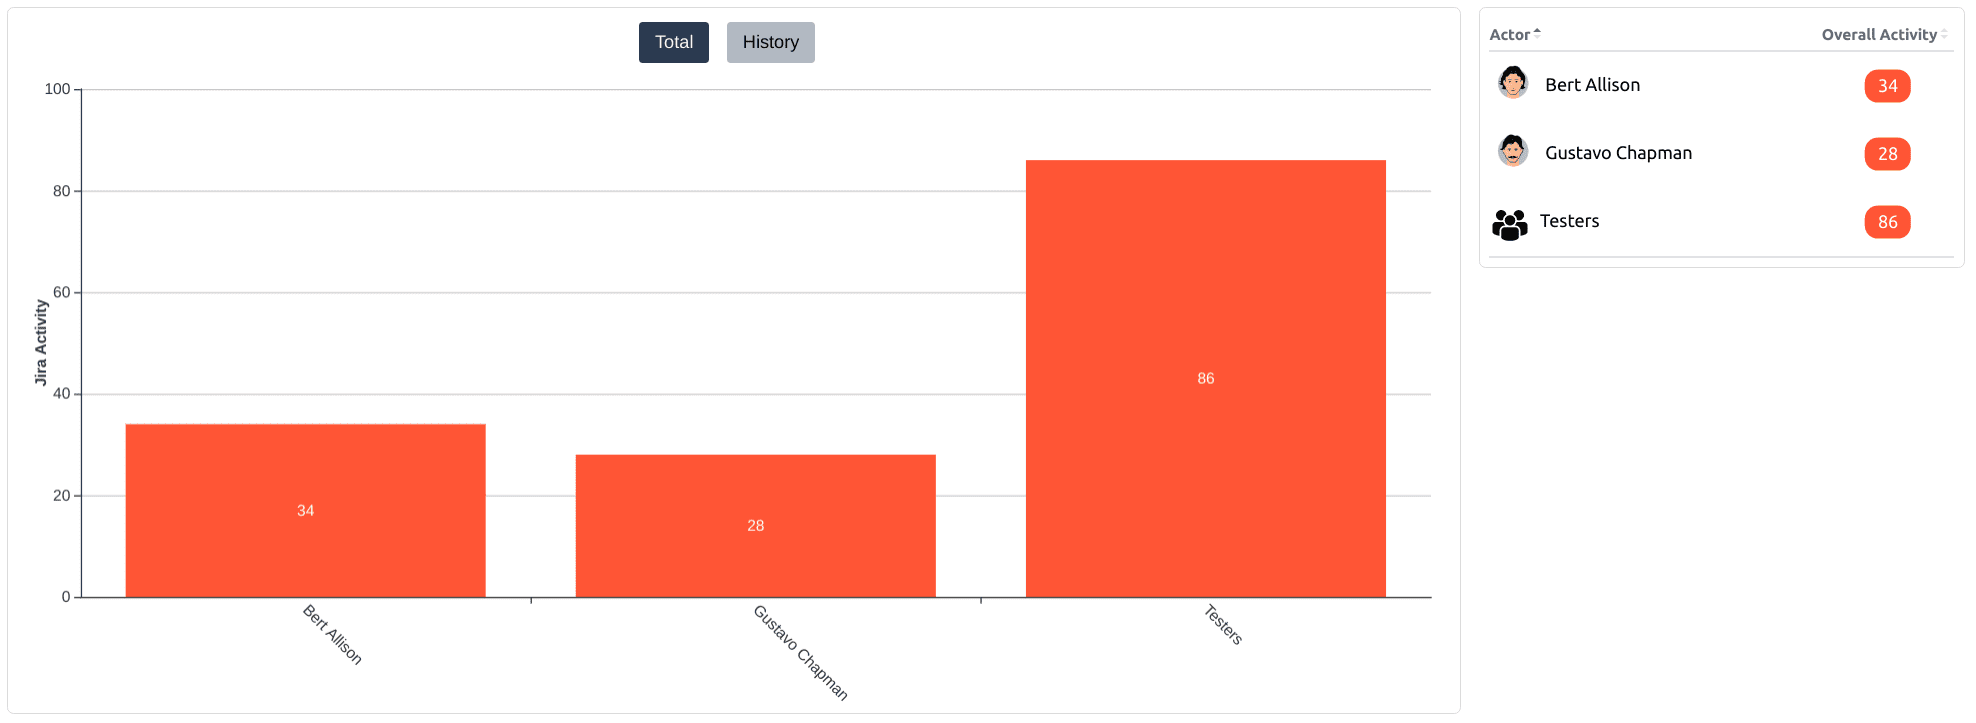
Clicking on bars or table will show issues that given actor interacted with (see Activity Types).
History
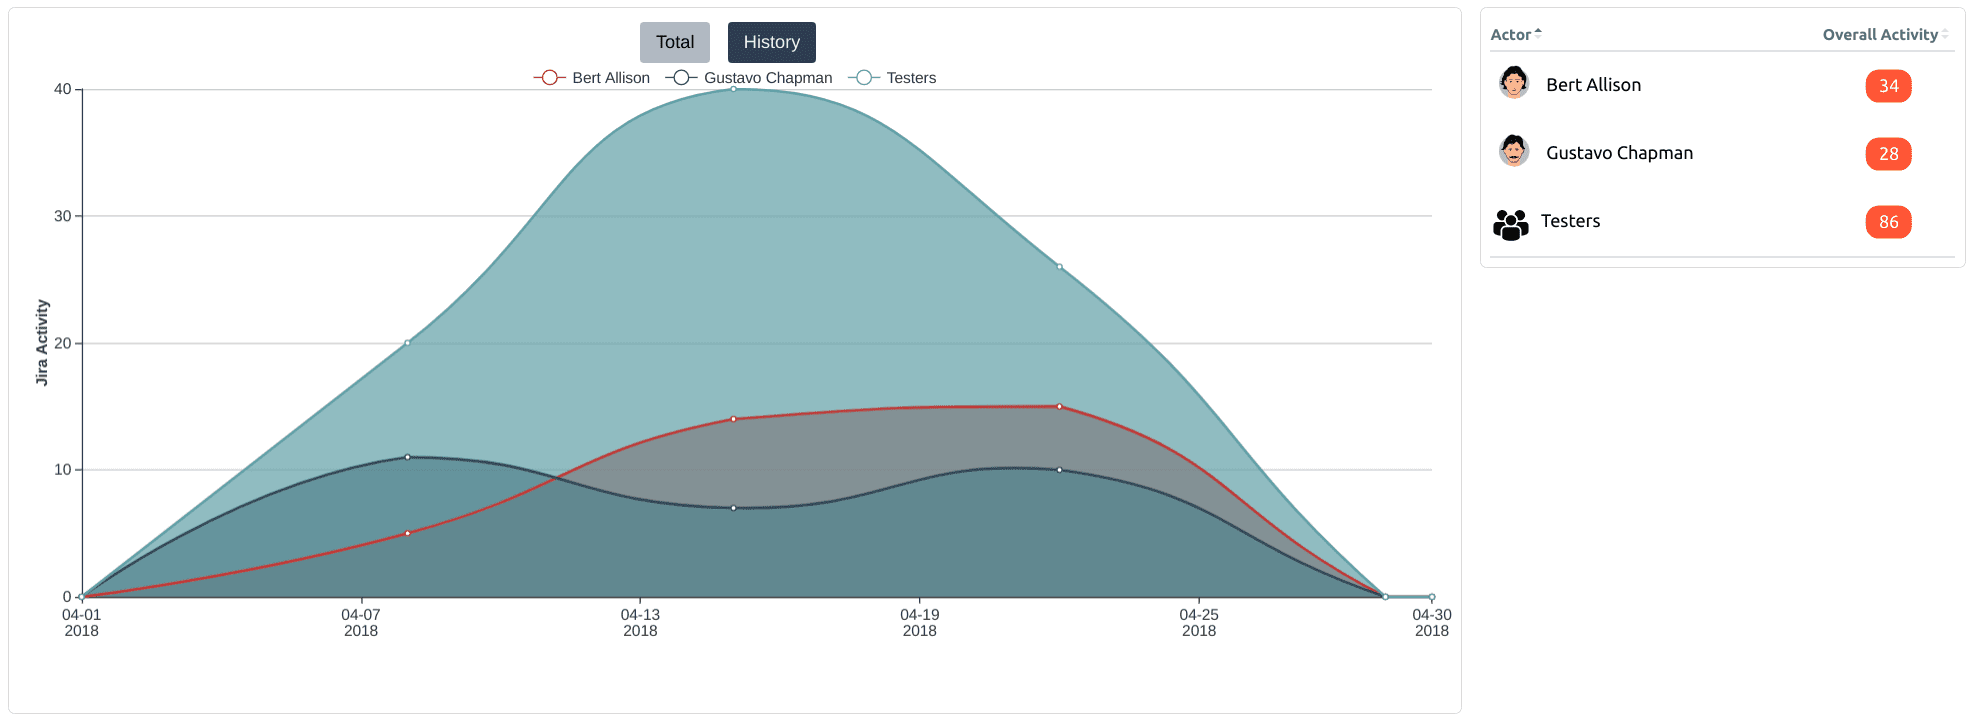
Clicking on datapoint shows all issues that given actor interacted with (see Activity Types).
Story Points Closed
Is a measure that sums story points in tickets that have been closed. A user who closed ticket (changed its status to “Done”) is credited.
This measure supports two ways of displaying data – Total and History (learn more about this here).
Total
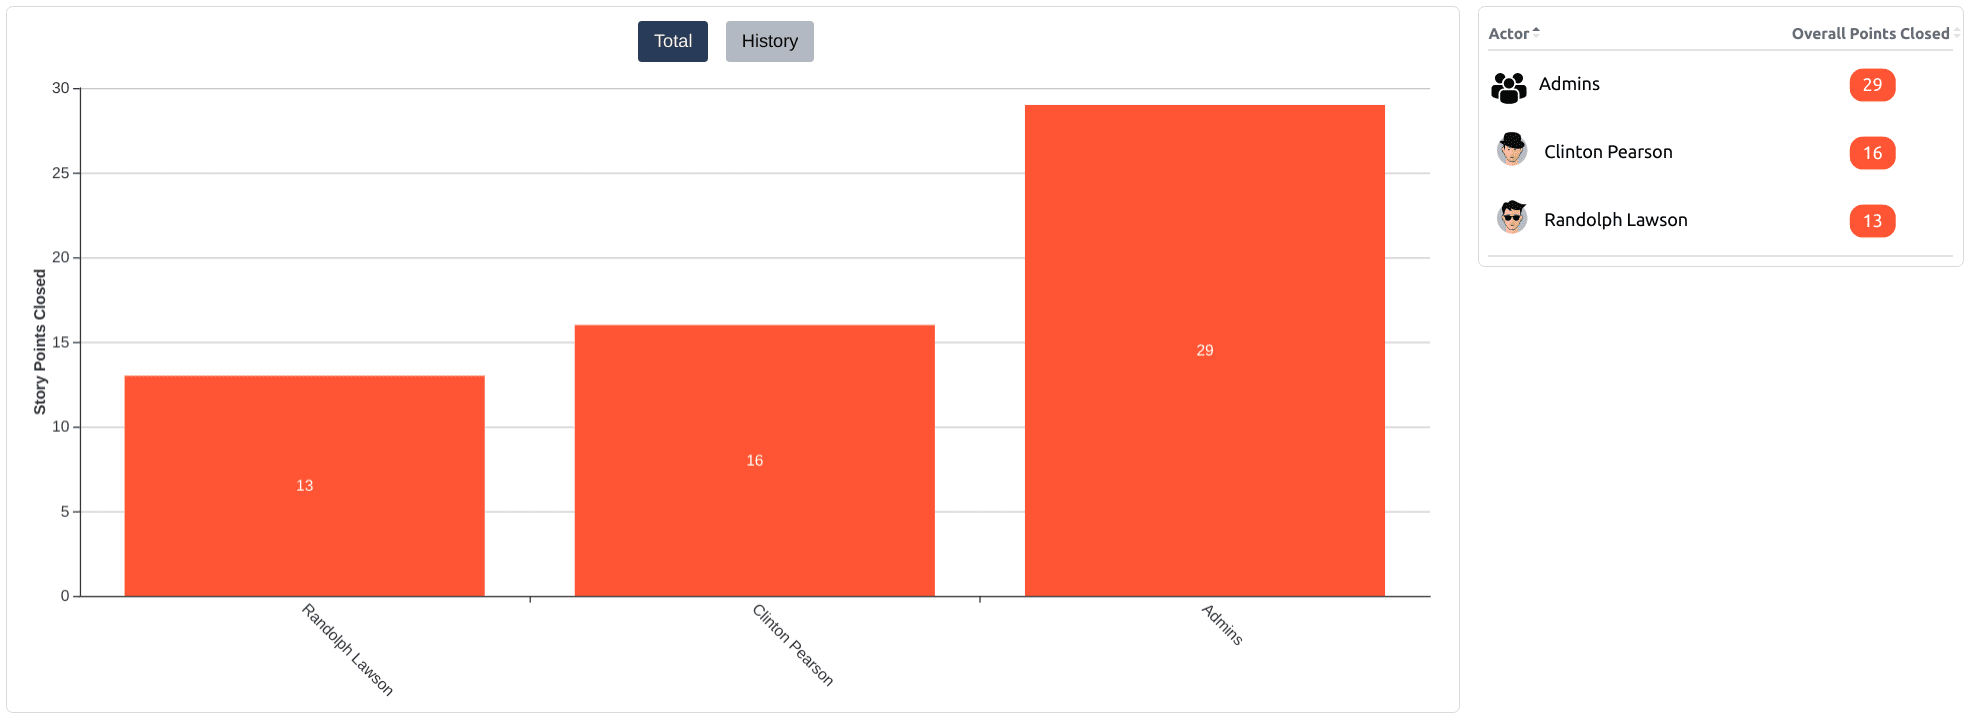
Clicking on bars or table will show issues that were closed by a given actor (in selected data range).
History
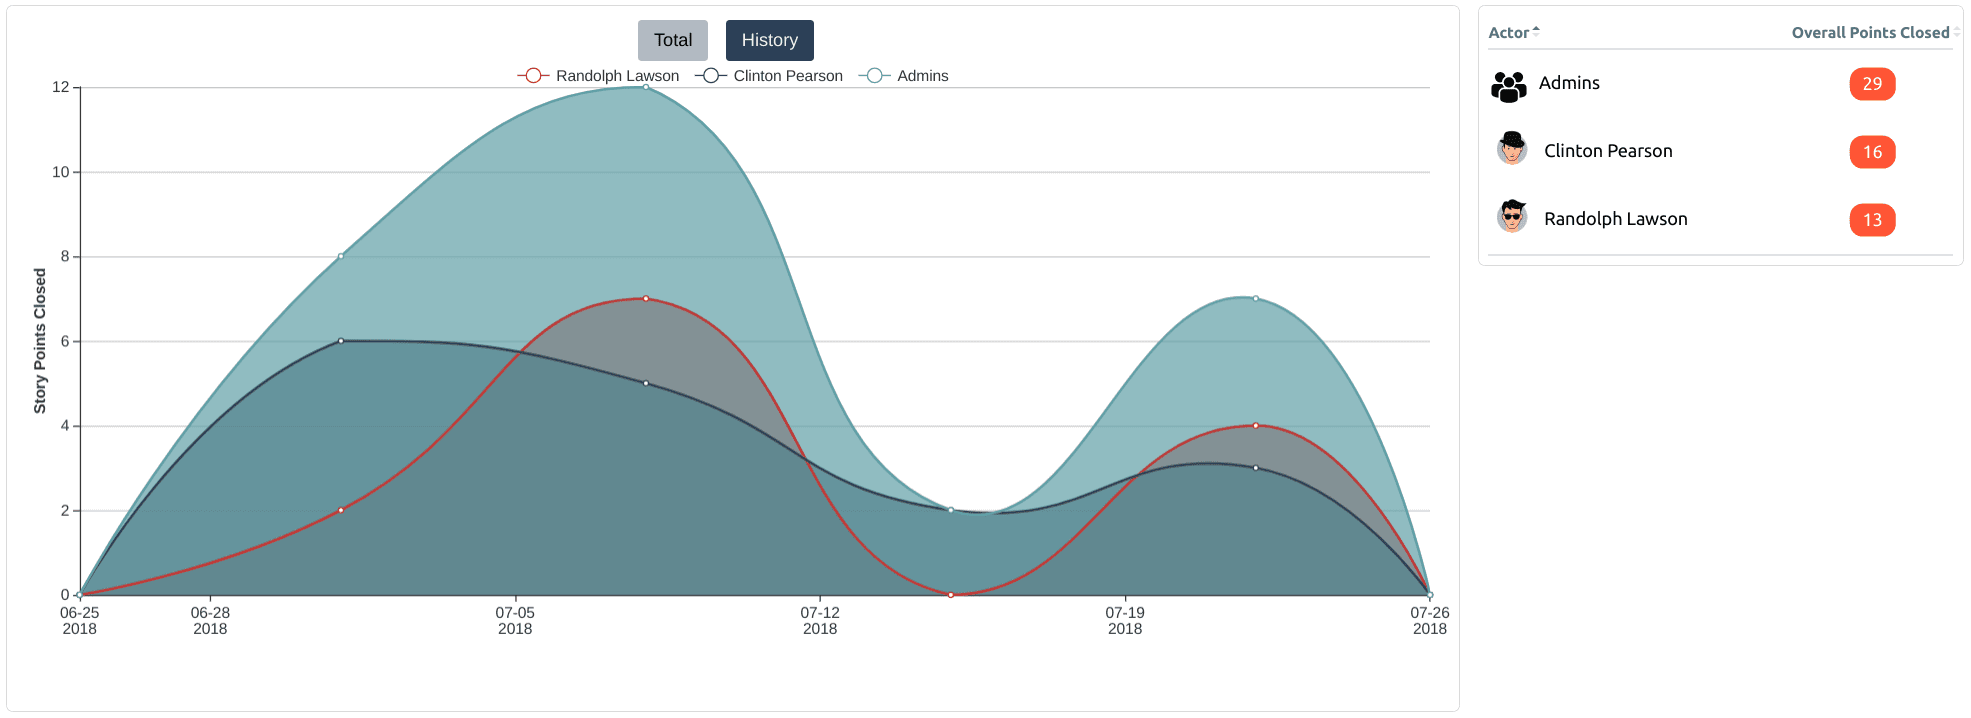
Depending on measurement, one or two types of charts will be available. If two are available, buttons for switching chart type will appear above chart:
Total chart
Measures
Shows total value in bars. Actors can be found on X-axis, and their total values on Y-axis.

Values on bars correspond directly to values in a table on the right side. Clicking on a bar will show you a list of issues that were counted.
Insights
Shows total value in one bar.

History chart
Linear history graph
Shows how the value changed over time. X-axis represents time, Y value in given time. Values are grouped into weeks.
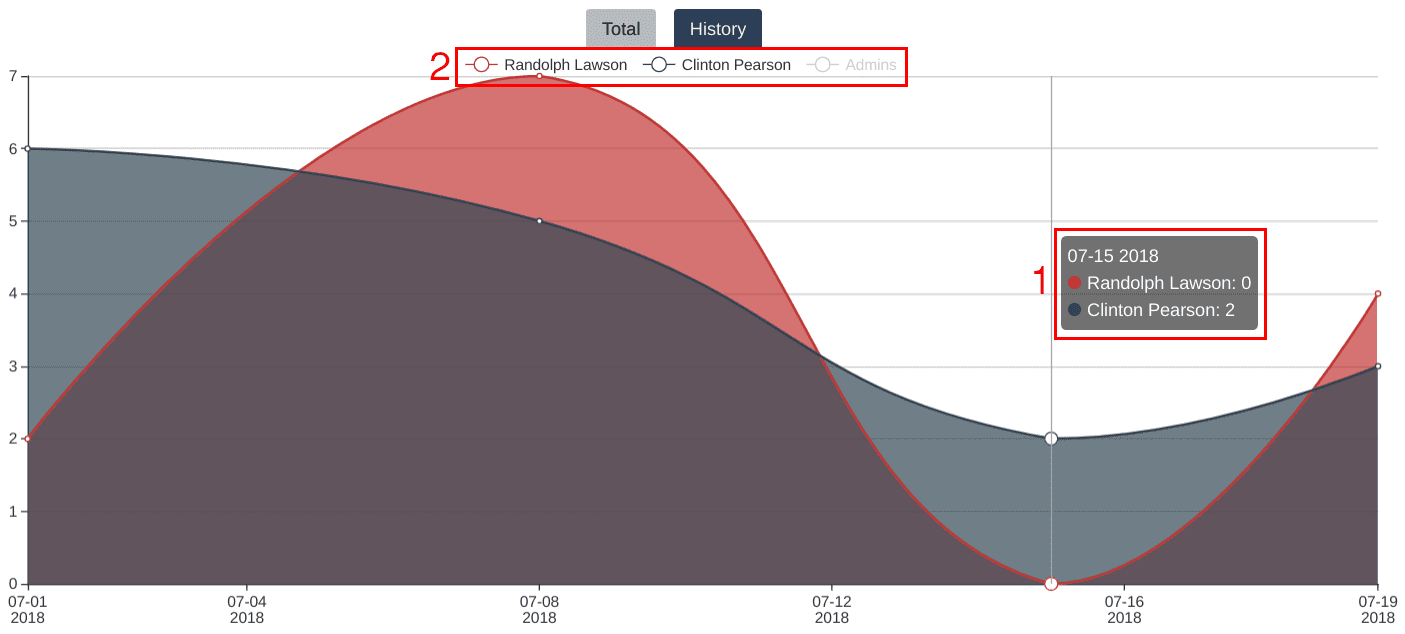
This type of chart has some extra functions (areas marked red on the picture above):
- When you hover over datapoint, a floating box will appear – it contains a date and exact values of every actor
- Actors can be toggled by clicking their name in top section of the chart. When an actor is not shown in graph, their name will be grayed out (e.g. “Admins” in picture above)
Clicking on datapoint will show you a list of issues represented by it.
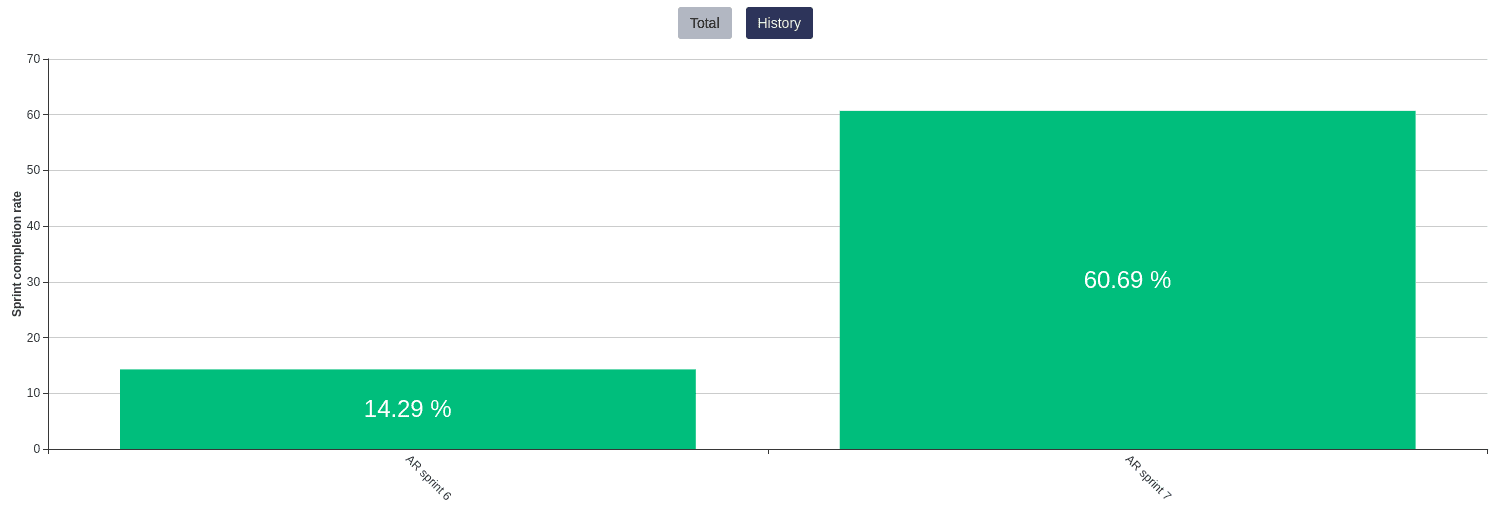
Bar history graph
History graph in Sprint completion rate insight consists of bars with completion percent for each sprint. Bars are ordered by sprint start date.
Double-sided linear history graph
History graph in Estimate Accuracy measurement consists of:
both positive and negative Y values representing estimate accuracy (respectively: over and under estimates)
- colorful mark area
- tooltip with details
X-axis represents time. Values are grouped into weeks.

Bug
created is an insight which shows a number of all created “Bug” type issues.
This measure supports two ways of displaying data – Total and History (learn more about this here).
On the right side of both graphs, there is a table where you can see how many issues were created each week.
Total

Clicking on bar or table will show issues type “Bug” that was created in selected data range.
History

Clicking on datapoint will show issues type “Bug” that was created in a given week.
Sprint
completion rate is an insight which shows percentage value of completion for your Jira sprints.
This insight supports two ways of displaying data- Total and History (learn more about this here).
Sprint completion rate calculation can be based on three different metrics chosen by the user: a number of issues, story points and time estimated. In the table on the right side, you can see commitment and completed values for each sprint. The bottom row shows Total value which takes into consideration all tickets from sprints above.
Total
In total graph, there is a percentage value of completion from all sprints from the selected date range and project.
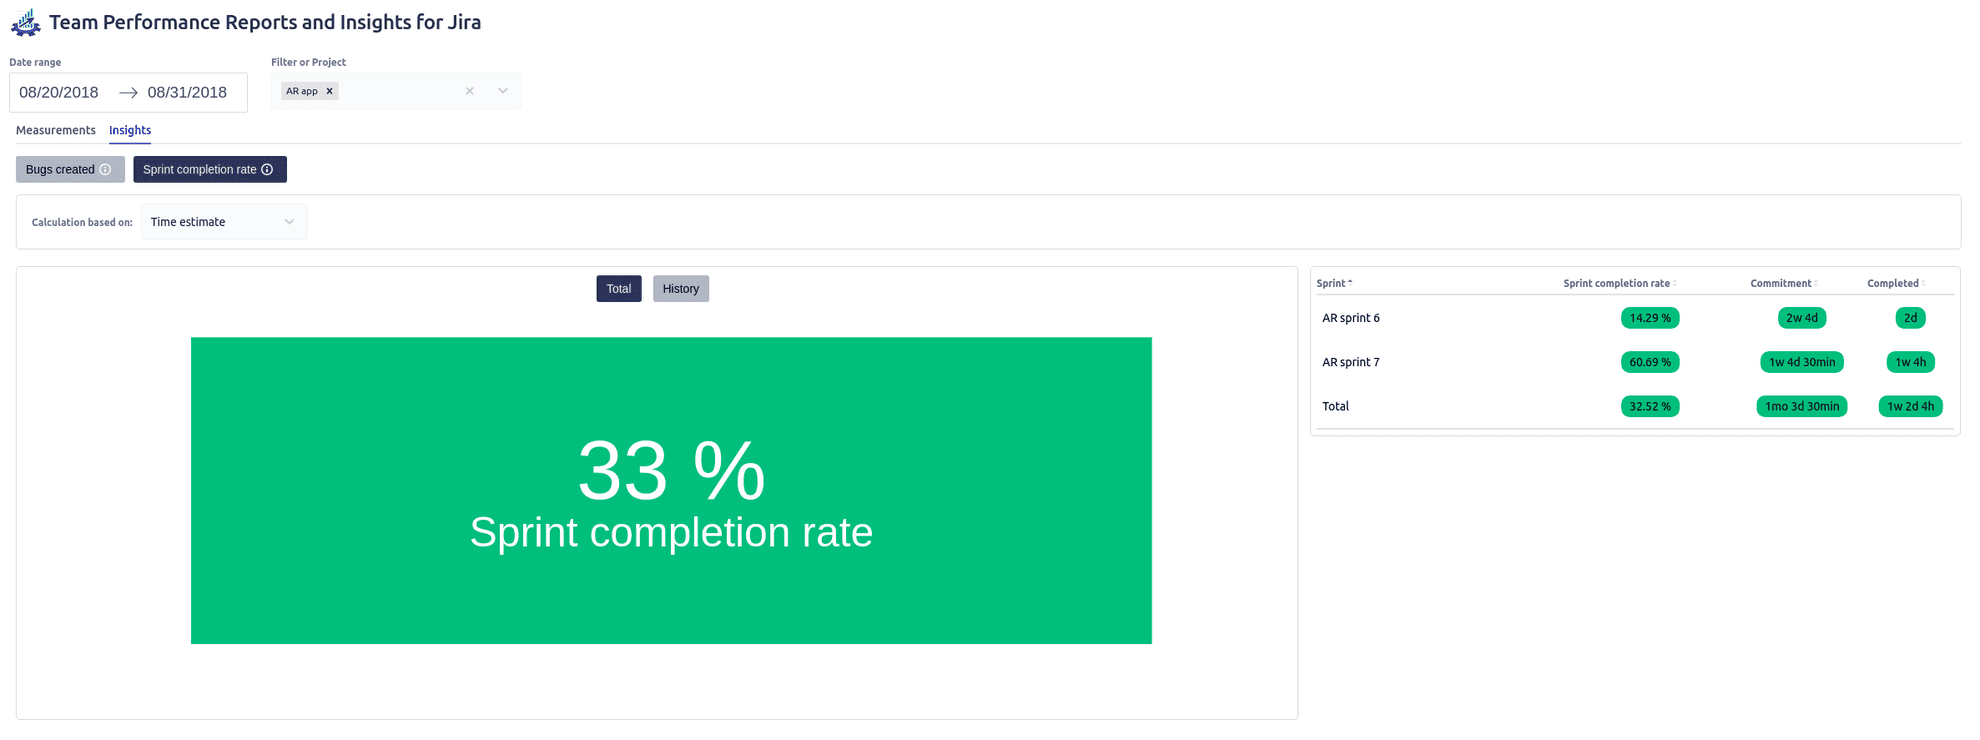
Clicking either on the graph bar or the data table will show issues included in the selected sprint in the Jira issue viewer.
History
The history graph shows the bar for each sprint representing percentage value of completion rate. Bars in the graph are sorted by sprint start date.
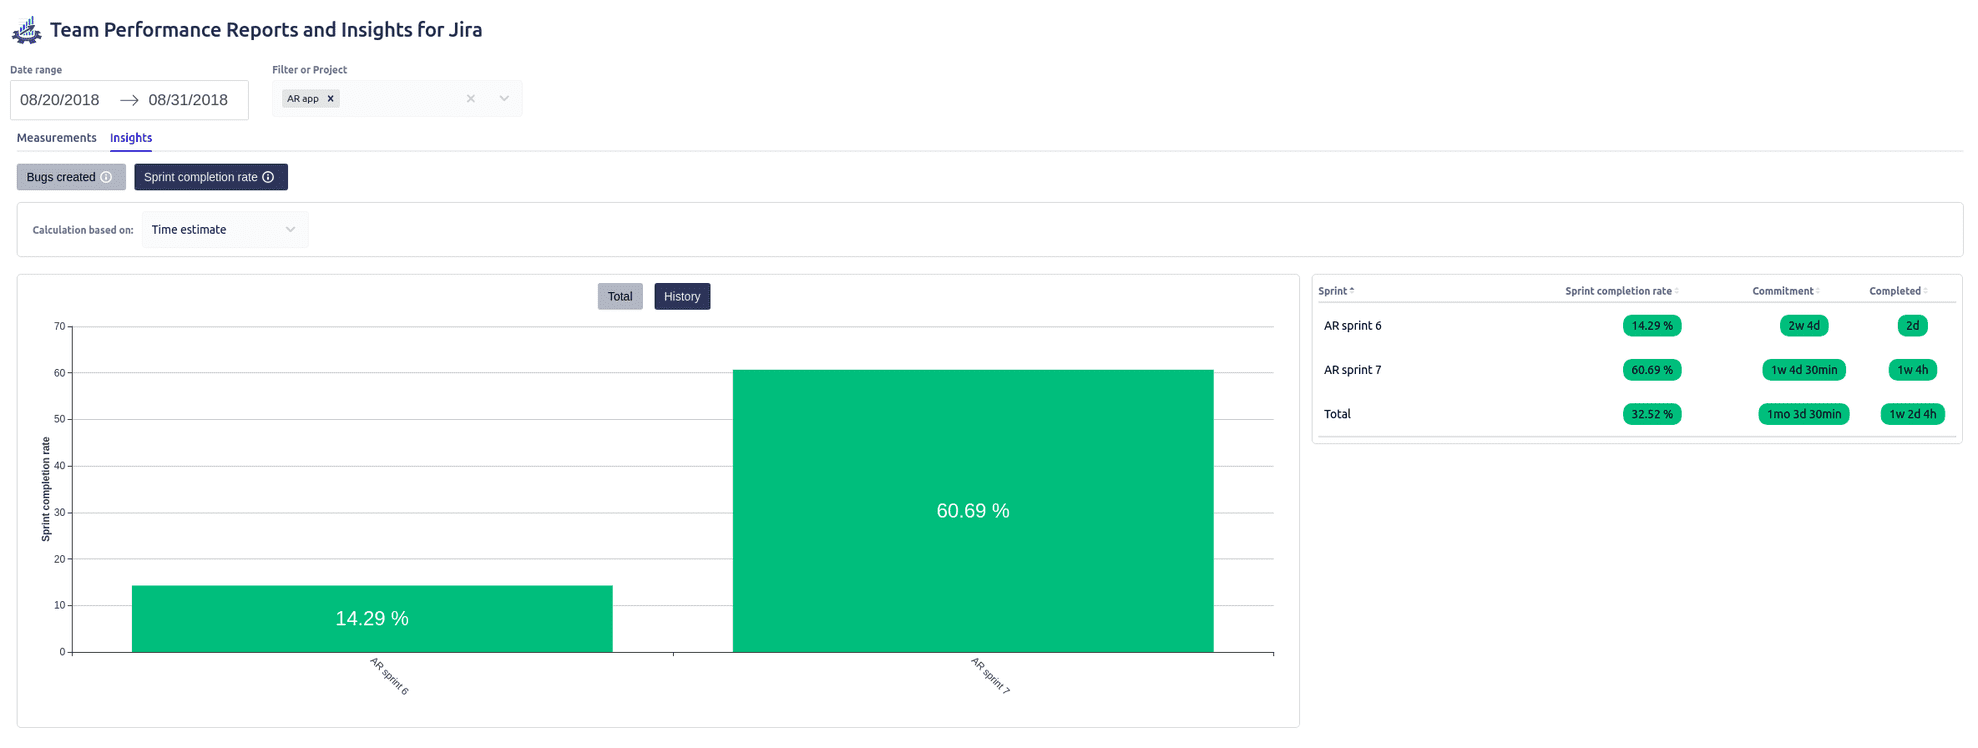
Clicking on a graph bar will show issues included in that sprint.
Do you want to experience how it works?
Please try out our 30-day trial version of the addon. You will get unlimited access to all the features:
You can also watch the demo on our YouTube channel:
